TV Viewing Behavior Shift: From the Pandemic and Beyond

The Coronavirus pandemic created a surge of media consumption, whether on television broadcasts or smartphones (or other devices). Streaming sites attracted new users, TV consumption significantly increased, and more Americans were drawn to bigger screens.
Sales increased by 53% for TVs larger than 65-inches in Q1 2020. Several studies suggested an increase in OTT viewership & streaming platforms. Factors such as time spent with families, ease in accessibility, type of regional content served on US-based platforms made them a huge success. Platforms such as Netflix, NBC, and Disney+ created TV apps for bringing consumers directly to their sites.
Although those are the numbers from 2020, how does that compare to 2024? Nielsen released a report in March 2024, streaming services and platforms have overtaken the over TV usage options; with streaming coming in at 38.5%, broadcast at 22.5%, cable at 28.3% and other options at 10.7%.
The data suggests that the time spent mostly at home four to five years ago has changed our viewing habits for good. With streaming services allowing TV watchers to view what they want, when they want it. As noted in the Nielsen report, “Almost 36 months later, the broadcast category has lost just 2.9 share points compared with 11.2 points given up by cable, and the streaming category has gained over 12 points.”
Also, since 40% of US households were using a smart device, smart TVs became more popular than ever in 2020. In 2023, it was reported that $26 billion was spent on connected TV (or CTV) advertising, leading those in the ad industry to continue to spend money on CTV rather than just on traditional TV channels.
The Subscription Video on Demand (SVOD) allowed consumers to watch popular content at a fixed rate per month, and at no other point than in 2020 was it at its peak due to the amount of time people spent at home.
Most of the popular platforms such as Amazon Prime, Hulu, and Netflix were included in these TV packages or bundles. Streaming services saw a huge increase in original and short-form video content as well. While it was observed that streaming services reached an even higher engagement and better subscriber growth during the pandemic years, a permanent shift took place from linear to digital platforms.
The Shift in TV Viewing During the Pandemic
Over the course of the last five years, we’ve seen a shift in TV watching habits, regardless of the segmented age of TV consumers.
Shift in Media Consumption by Generation
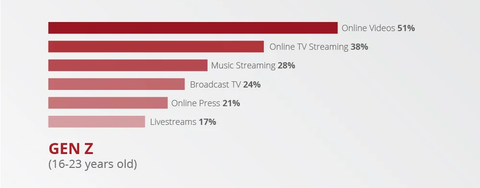
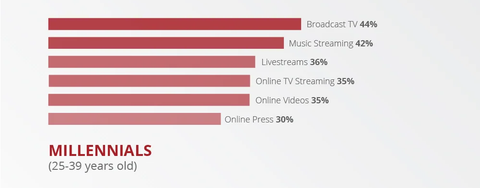
Percent Who Say They’ve Started Consuming More of the Following Since Covid/2020
From a trends-perspective, the generations look fairly similar; however, one segment that seems to have emerged from the Covid-era of media consumption was through online TV streaming and online videos.
In fact, millennials — those between 25 and 39 years of age (now, moreso around 27 and 41) — look to be the outlier as Broadcast TV emerged as the most prominent media platform that “won” amongst the three specific generations.


Shift in Streaming Behaviors
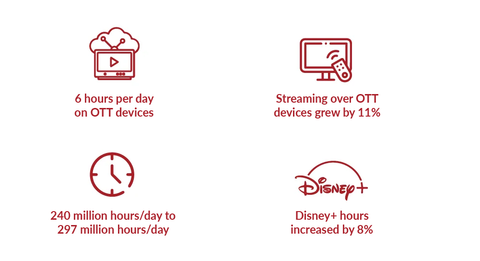
Not only was there a shift with non-online platforms, but the results discovered within each of the generation’s data showed that streaming devices, including paid subscription services, saw a large increase in consumption and users.
Additionally, there was an increase in app subscriptions from an average of three paid streaming video subscriptions to four during the pandemic.

The Shift in Viewing Trends by Yearly Household Income Level
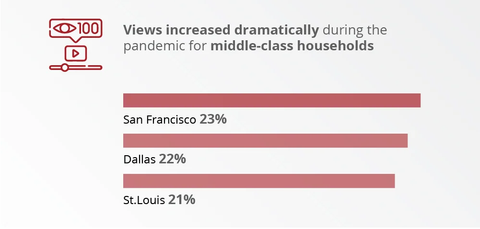
It’s not just generational shifts in the type of media consumption that has evolved over the past four years but also the type of households that consume local news and geographical locations in the U.S. that saw changes.


Consumption Insights During the Pandemic
Connected TVs
Time spent viewing in connected TV households increased from 2.7 billion hours to nearly 4 billion hours during the pandemic.
By May 2020, when the lockdown lifted across several states, connected TV usage dropped to only 3.5 billion hours per week, which was still higher than the number in 2019. That said, the amount of hours and the number of people watching connected TV has seen different trends, as CTV users in the U.S. will see more than 62.5 million users in 2025 (whereas it was 57 million users in 2020).

New Markets for the Future
During the pandemic, 38% of consumers tried a new digital activity or subscription for the first time. The most popular were live-streamed events and watching videos with others through a social platform, web app, or video conference.

Thanks to the data regarding media consumption from the pandemic and the subsequent learnings of how people used TV, media, and technology, there will be a wealth of new insights into how TV watchers, in 2024 and beyond, watch and consume television, movies, sports, and others.


